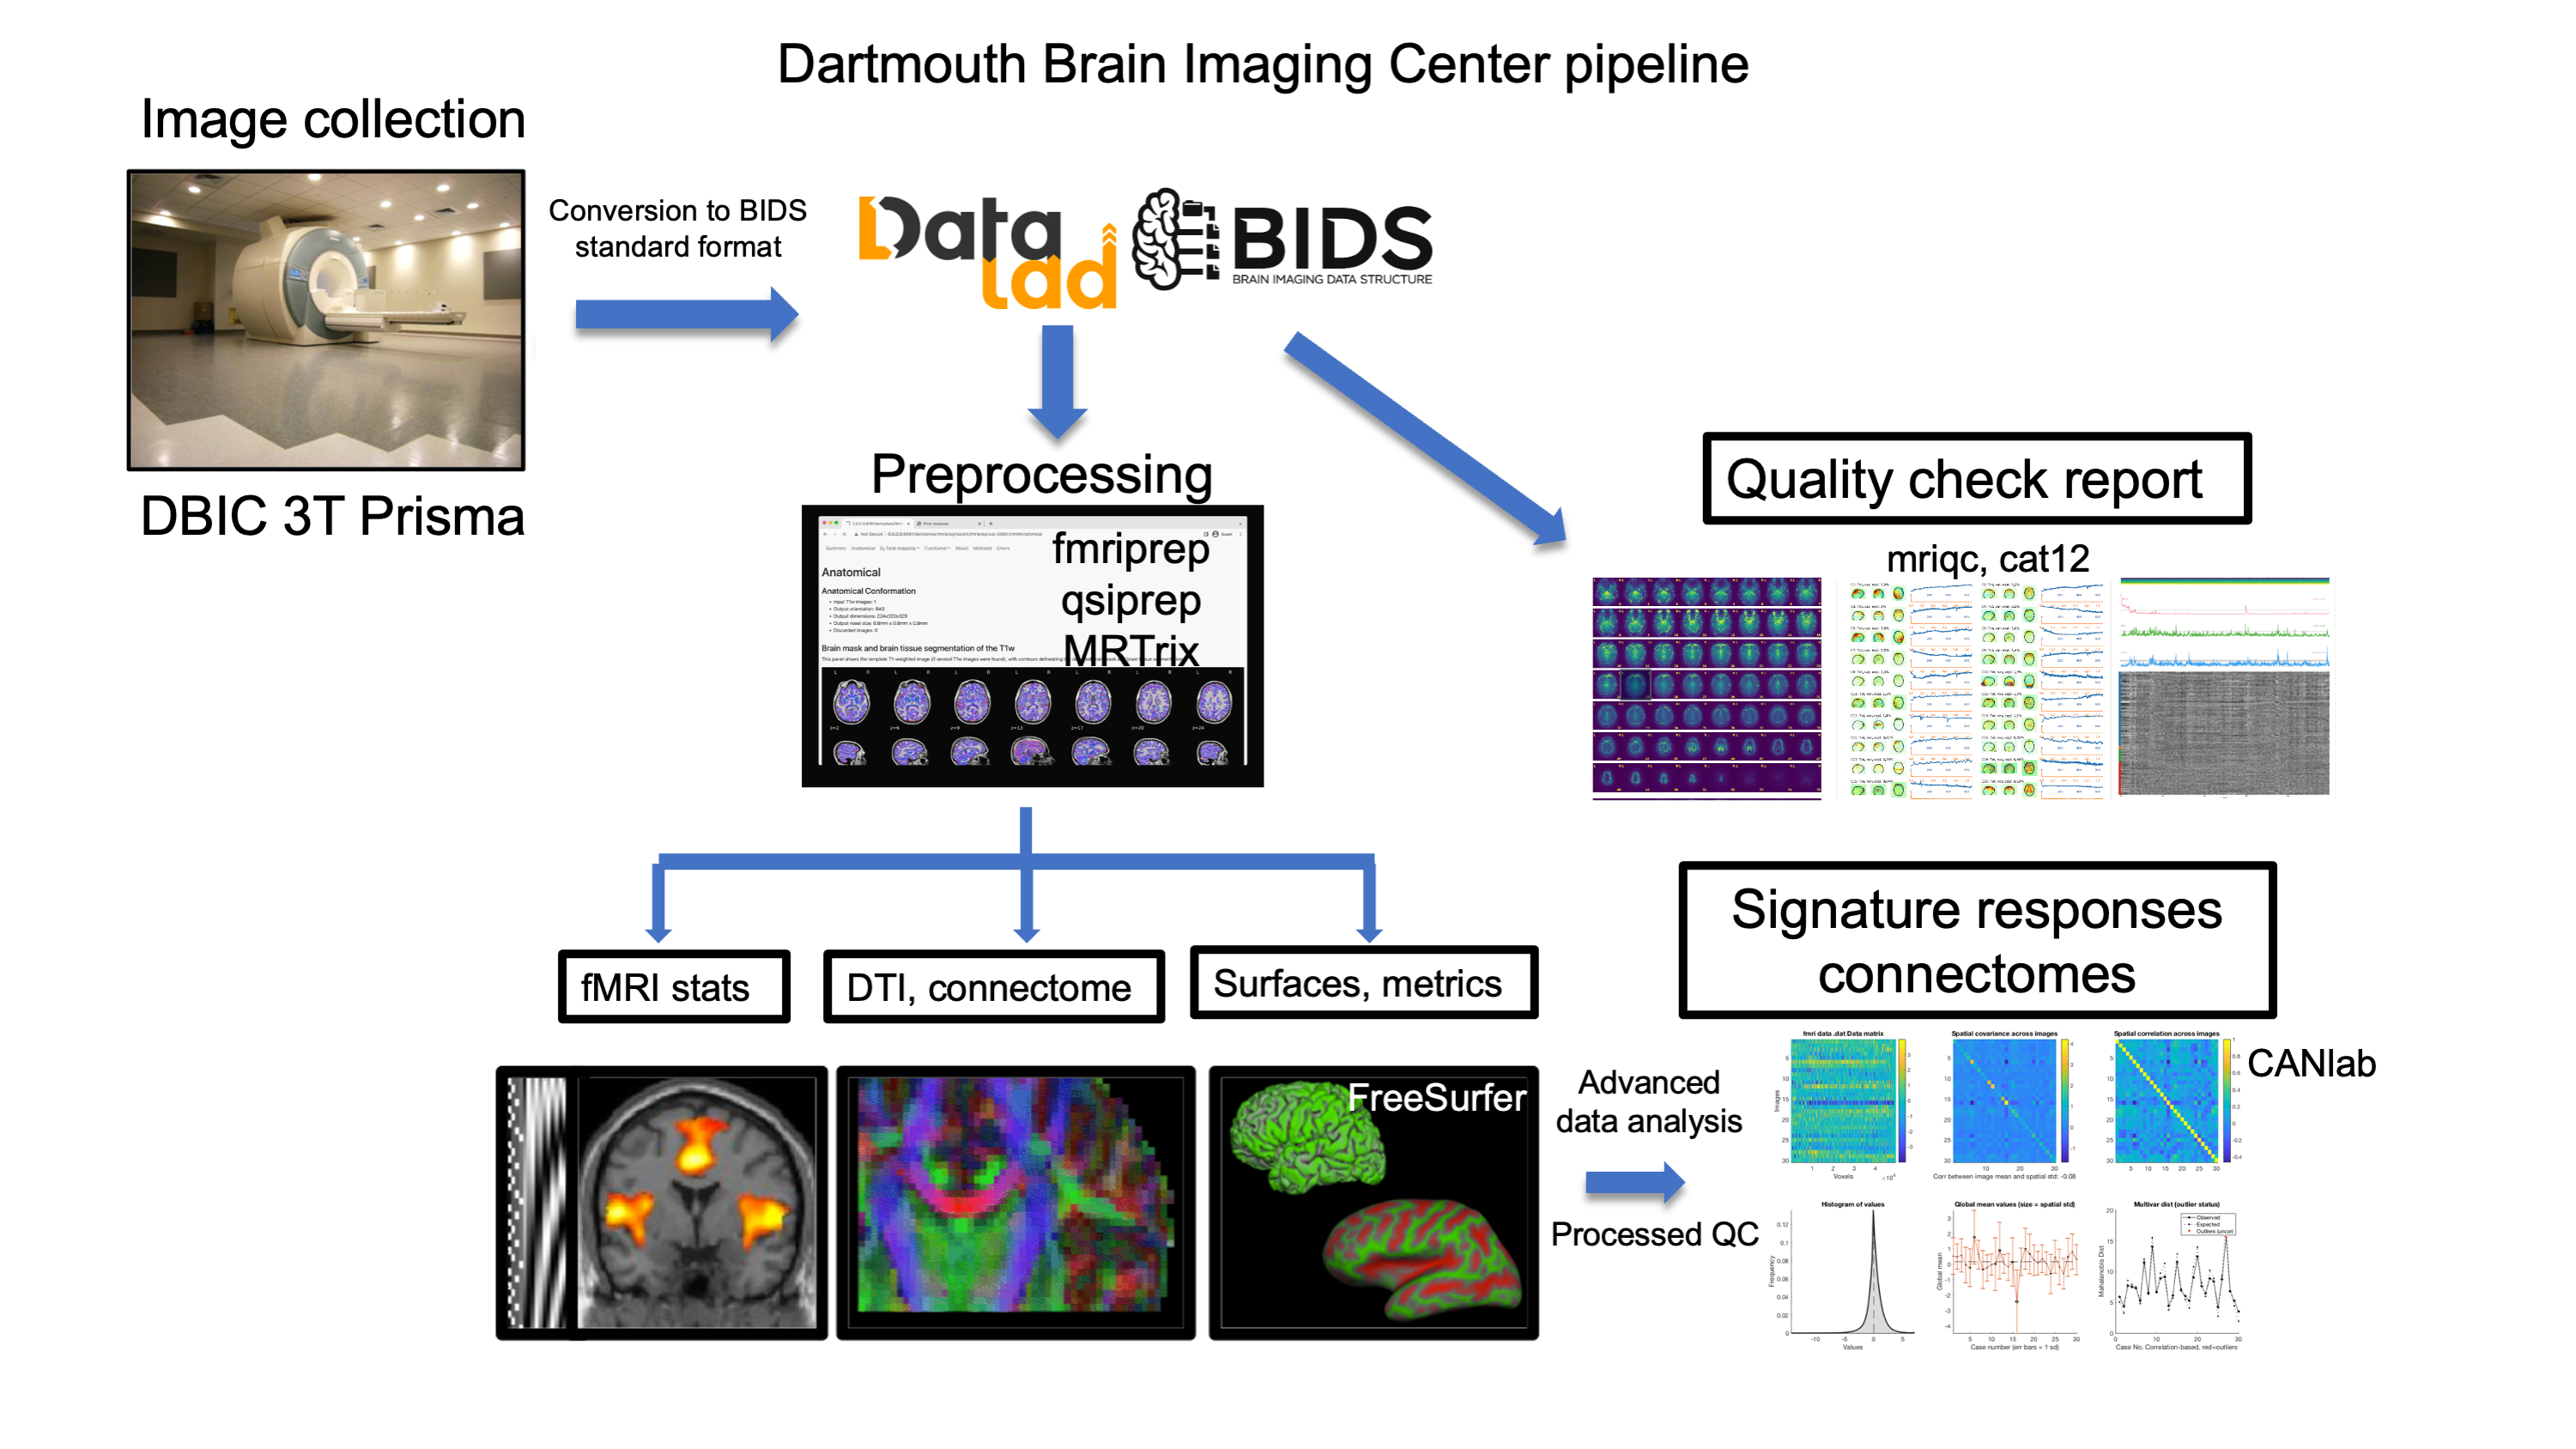
A standardized, reproducible data pipeline carries every study from the raw DICOMs on the Siemens console through archiving, BIDS conversion, preprocessing, and quality control — all the way to multivariate brain signatures and whole-brain connectomes.
Operated by DBIC & Dartmouth Research Computing · Standardized for all studiesThis pipeline is part of the DBIC fMRI workflow — the automated processing path for data collected on the 3T fMRI scanner.
Every scan follows the same route, so results are comparable and reproducible across studies. Data flows automatically from the scanner into managed archives and shared storage, is converted into community-standard formats, and is then preprocessed and quality-checked with well-established, openly available tools — before any lab-specific analysis begins.
The moment images reconstruct on the scanner, they begin an automated journey into safe, backed-up storage — no manual transfers required.
Reconstructed DICOM images are pushed directly from the scanner console as each series completes.
DICOMs pass through an Orthanc server that runs integrity checks and holds a temporary working copy.
Scans appear on the DartFS network file system immediately, with group permissions set nightly for the registered study.
Data is converted into the Brain Imaging Data Structure (BIDS) using the ReproIn naming convention, producing NIfTI images alongside JSON sidecars that carry the acquisition metadata. Datasets are tracked with DataLad for transparent versioning and sharing, and a BIDS validation step flags missing, corrupt, or metadata-related errors before analysis proceeds.
A suite of established, openly available tools turns organized data into analysis-ready derivatives — consistently, across every modality.
Realignment, coregistration, and MNI normalization, with motion and outlier derivatives generated for functional data.
Cortical surface reconstruction with cortical thickness and volume estimates for anatomical analysis.
Diffusion preprocessing and modeling for tractography and structural connectivity.
Voxel-based morphometry for whole-brain analysis of gray- and white-matter structure.
DTI and arterial spin labeling (ASL) processing for diffusion and perfusion measures.
Outputs in standard spaces with confound and quality metrics, ready to plug into downstream BIDS apps.
Before data reaches analysis, MRIQC and cat12 generate quality-control reports for each dataset. These summarize image quality, evaluate coregistration, surface possible artifacts, and provide quantitative metrics — giving researchers an objective basis for including or excluding scans.
With clean, standardized derivatives in hand, studies move to multivariate and network-level analysis using CANlab tools developed at Dartmouth.
Whole-brain multivariate patterns that serve as sensitive, interpretable brain signatures of mental states.
Region-to-region connectivity built on standard atlases for network-level analysis.
Connectivity estimates adjusted for motion, CSF signal, and outliers using CANlab tools.
The pipeline is standardized for all DBIC studies and operated jointly by the DBIC and Dartmouth Research Computing. Once a study is registered, its data flows automatically from the scanner into DartFS and can be converted, preprocessed, and quality-checked using the shared, reproducible tooling described above. Research Computing supports setup, access, and troubleshooting.