Overview
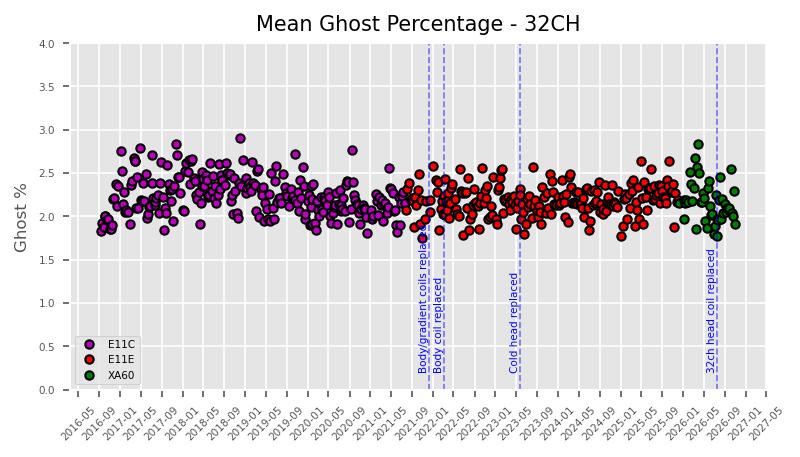
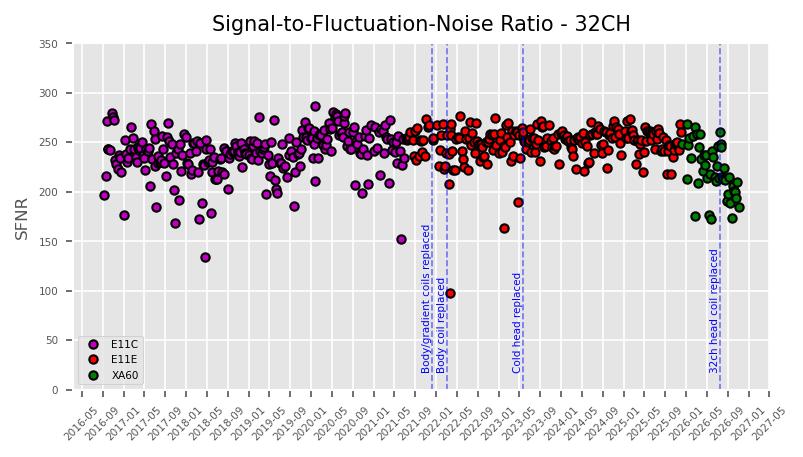
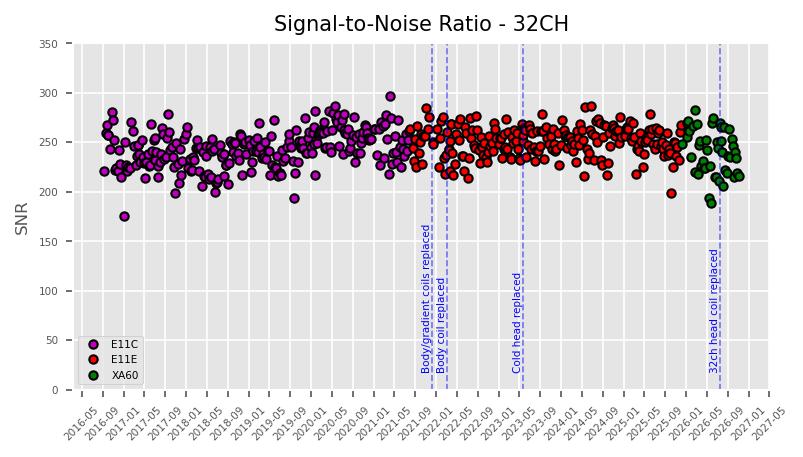
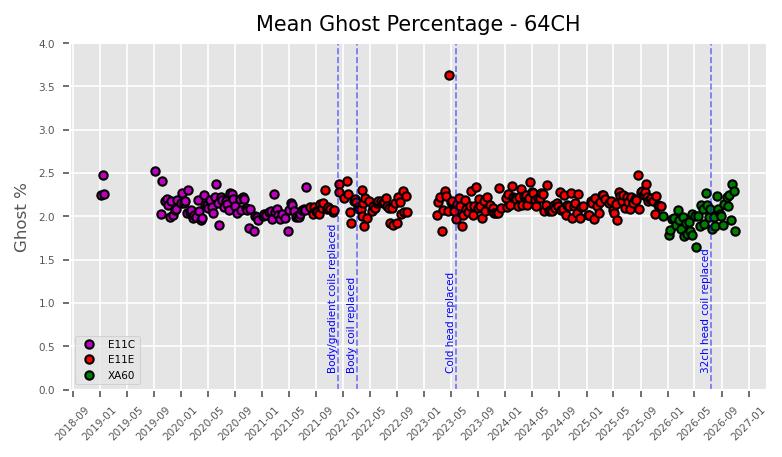
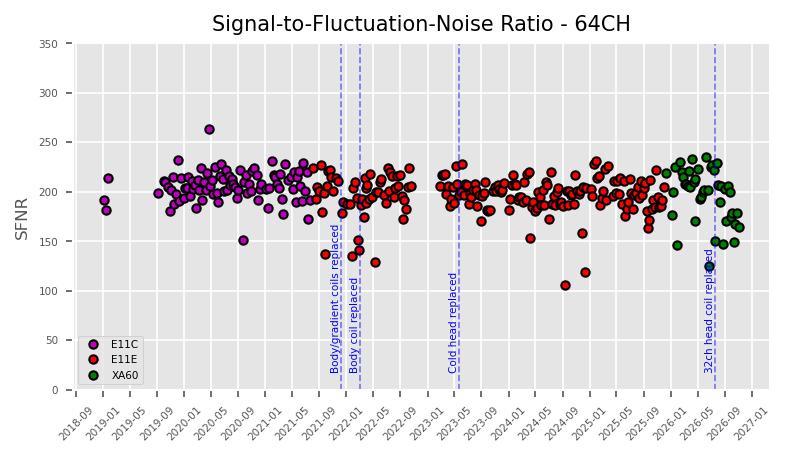
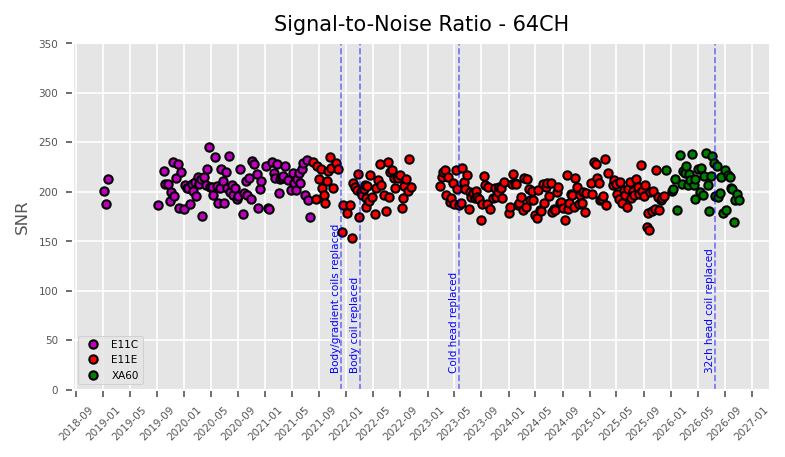
QA metrics using the tools created by the Function Biomedical Informatics Research Network (fBIRN) are generated on weekly basis to monitor stability of the scanner. These scans run a standardized fMRI protocol executed on an agar phantom using the DBIC’s 32- and (since 2018) 64-channel head coils. Details of the FBIRN protocol can be found on the NITRC fBIRN project page and in the references below. Longitudinal results for mean ghost percentage, signal-to-fluctuation-noise ratio (SFNR) and signal-to-noise ratio (SNR) are updated here weekly. Abnormalities in any of the metrics may indicate instability of some hardware component, and such abnormalities are investigated. In addition, the Siemens customer QA tool is run to check coil elements of the head coil (weekly) and body coil (monthly) and as needed.
The acceptable mean ghost percentage is less than 3% (ref. 2). The first QA on DBIC’s Siemens Prisma was conducted on Sep 12, 2016.
32-channel head coil
64-channel head coil
Weekly QA metrics
Below are definitions of the metrics found on the DBIC’s weekly QA report. Definitions have been adopted from the original authors.
- Signal image - the mean signal across time
- Signal summary value - the mean across the ROI of the signal image
- Standard Deviation Image (Temporal Fluctuation Noise Image) - voxel by voxel residuals of second-order polynomial fit across
- SNR - the signal value (‘mean’) divided by the image standard deviation; provided as a summary value (using mean across the ROI of the static spatial noise image) and as an image
- SFNR - calculated voxel-by-voxel across a 21×21 ROI in the center of a phantom after removing a second-order polynomial trend from each voxel’s time course; the mean signal image is divided by the standard deviation of the detrended residual image (provided as a summary value using the average across the ROI and as an image)
- Percent fluctuation - 100*std/msi where ‘std’ is a summary value calculated as the standard deviation of the residuals of a second-order polynomial fit of the time series and ‘msi’ is mean signal intensity of the time-series.
- Drift - 100*(maxroi-minroi)/msi where ‘maxroi’ and ‘minroi’ are the maximum and minimum values of the mean raw signal over the ROI.
- Driftfit - 100*(maxfit-minfit)/msi where ‘maxfit’ and ‘minfit’ are the maximum and minimum values of the fit.
- Fourier Analysis (Magnitude Spectrum) - the frequency spectrum resulting from a Fourier analysis of the residual data.
- Radius of Decorrelation (RDC) - a measure of the size of ROI at which statistical independence of the voxels is lost.
- Smoothness (Full-width Half-maximum) - calculated using the AFNI tool 3dFWHMx
- Center of mass - a simple mean intensity of each volume, with each voxel’s value weighted by its index in the X, Y, or Z direction.
- Odd-Even Difference Static Noise Image - created by subtracting the sum of even-numbered time-series frames from the sum of odd-numbered frames, and captures static noise (thermal/electronic)
- Mean Ghost Percentage - 100*meanGhost/meanSignal. The ghost metrics are calculated for each volume by taking a dilated mask (“original mask”) of the data, and shifting it by N/2 voxels in the appropriate axis to create a “ghost mask”. The mean intensities of those voxels in the original mask and not in the ghost mask (“meanSignal”) and of voxels in the ghost mask and not in the original mask (“meanGhost”) are calculated.
References:
-
Friedman L, Glover GH. Report on a multicenter fMRI quality assurance protocol. J Magn Reson Imaging. 2006;23(6):827-839. PubMed: 16649196
-
AAPM Report No. 100: Acceptance Testing and Quality Assurance Procedures for Magnetic Resonance Imaging Facilities. American Association of Physicists in Medicine, Dec 2010. AAPM report page
Weekly QA reports
2026
2025
2024
2023
2022
2021
2020
2019
2018
2017
2016
Phantom
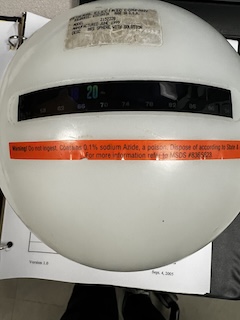
The DBIC collects its QA data using an agar phantom manufactured in 1999 by the General Electric Company, model number 2152220.